Analytics Dashboard
Monitor traffic, track click interception, and analyze rule performance
The Analytics workspace provides marketing teams with visibility into visitor traffic volumes, link interception rates, and rule performance.
1. Navigating the Analytics Tab
Under any project, click the Analytics tab to view your performance dashboard. This screen aggregates telemetry emitted by the client-side widget in real-time, helping you measure the performance of your marketing channels.
2. Key Metrics & Sections Explained
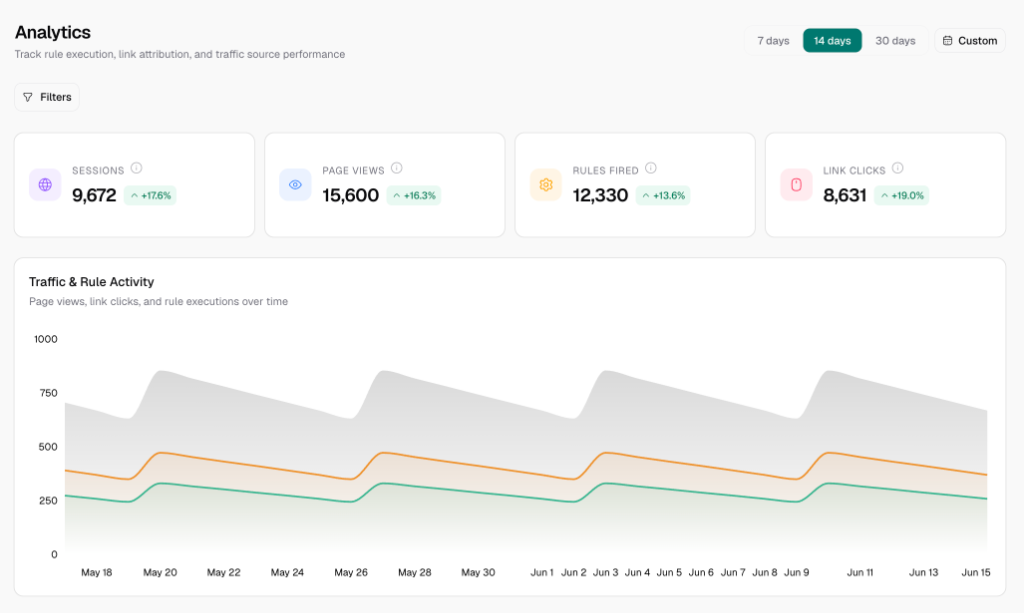
The dashboard features several key tiles and charts:
- Views: The total count of page views tracked across all pages where the widget is deployed. This helps you monitor general website traffic.
- Clicks: The total count of outbound link clicks or form submissions intercepted and rewritten by the Cogwheel rules engine. This represents direct intent to book.
- Sessions: The count of unique visitor sessions recorded on the vanity site. A session preserves the visitor's original landing parameters across multiple page views.
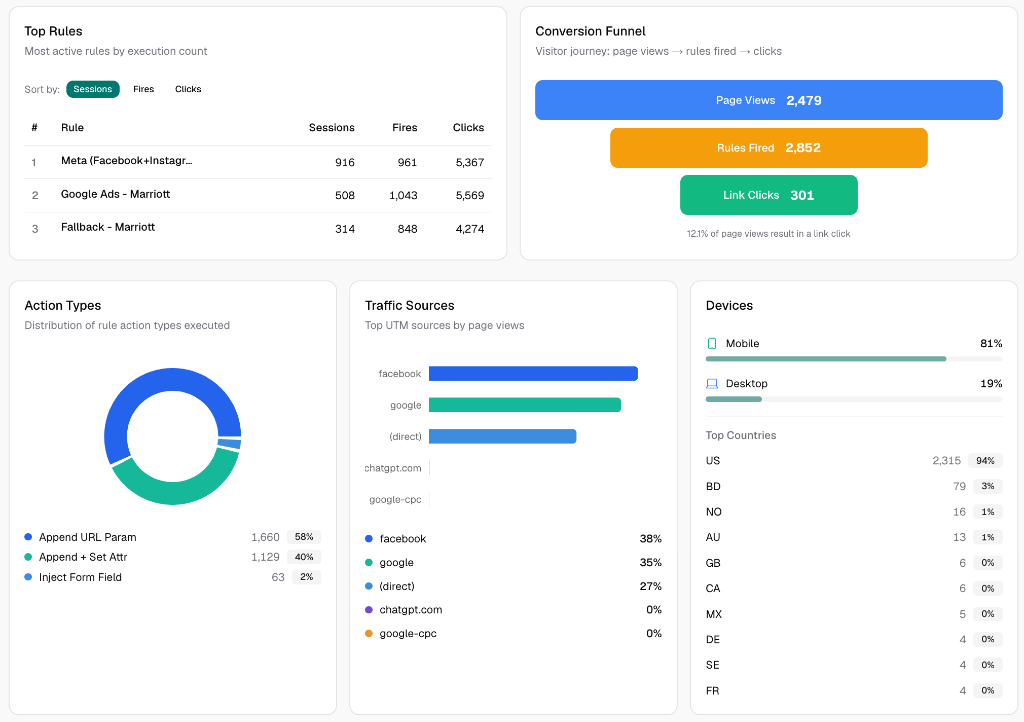
- Rule Performance Chart: A visual chart (powered by Recharts) showing how many times each rule has fired over time. This highlights which campaigns (e.g., Google Ads vs. Meta Ads) are driving the most booking engine clicks.
- Rule Activity Log: A tabular log displaying recent rule executions. You can see:
- The name of the rule that fired.
- The target URL (e.g.,
marriott.com). - The exact parameter value injected.
- A timestamp.
3. Real-Time Telemetry & Processing Delay
Cogwheel Attribute utilizes a high-performance edge analytics pipeline:
- Edge Ingestion: Telemetry is pushed from the visitor's browser to our Hono API running on Cloudflare Workers.
- Real-Time Display: In ordinary conditions, page views and clicks will reflect in your dashboard within seconds.
- Queue Processing Buffer:
- Due to network queues, browser caching, and edge data buffering, a 1 to 2-minute delay can sometimes occur before events populate the charts.
- If you are QA testing or checking live campaign launches, wait up to 2 minutes for your test actions to reflect in the Analytics dashboard.